

The pipelines in Wisconsin begin in the Athabasca mining region of Alberta, Canada and transport tar sands oil (or ‘crude bitumen’) to refineries. Tar sands oil is sludge-like and needs to be diluted with toxic chemicals to flow properly. Like many fossil fuels, tar sands oil has public health impacts throughout the extraction, transport, refinement, usage, and waste process. However, tar sands oil processing is 15 times more costly, more carbon intensive, the extraction destroys larger areas, and it has more negative health impacts than traditional crude oil (1, 2).

The extraction process also creates airborne particulates that are heavy with toxins such as nickel. An analysis of just 4 months of snowfall, found that within 50 km of facilities, 11,400 metric tons of airborne particulates were deposited in 2008 (11). Many of these particulates were polycyclic aromatic hydrocarbons (PAHs), which are known carcinogens, are associated with DNA damage, and can cause developmental impacts. In 2013, a study of people living downwind of the Edmonton upgrading facility revealed elevated risks of leukemia, childhood lymphohematopoietic cancer, and other cancers of the lymph and blood-forming system (12). Airborne contaminants in this rural area were higher than in some of the world’s most polluted cities, measuring-in at 6,000 times higher than normal air quality levels. But this study was not the first of its kind to expose detrimental health impacts in the region.
In fact, the Canadian government has been aware that tar sands extraction creates a deadly combination of air, food, and water pollution for more than 10 years. After doctors in communities near tar sands sites went public with concerns about rare diseases in their patients, the Alberta and Canadian governments commissioned a health study of Fort Chipewyan. Key findings in their 2009 report included a 30% higher cancer rate in the population and elevated rates of biliary tract cancers, blood and lymphatic cancers, lung cancers in women, and soft tissue cancers which are usually rare (13). These specific cancers have been tied to exposure to the chemicals produced in petroleum manufacturing (14). The population of Fort Chipewyan is primarily indigenous, leading environmental justice advocates to declare tar sands poisoning a violation of First Nation’s treaty rights.

Line 61 Expansion Proposal (Enbridge Inc.)
“Enbridge is fast becoming to the Midwest what BP was to the Gulf of Mexico, posing troubling risks to the environment...”
Oil spills occur more often in tar sands pipelines than traditional lines and have many adverse health effects. Thick tar sands oil has been compared to the consistency of peanut butter before it is steamed or strip mined from the sandy soil. To make it flow through a pipeline, it is diluted with large quantities of liquid chemicals like benzene, a known human carcinogen, and toluene, to form ‘dilbit.’
Dilbit is considered to be so acidic and abrasive that is more likely to corrode and weaken pipelines that conventional oil, according to several environmental organizations, though this is debated by the industry. Additionally, the dilbit is heated to make it thinner and increase its speed through the pipeline. With increased heat, and pressure in the pipeline, the risk of a pipeline rupture greatly increases.
Benzene and toluene pose short and long term health hazards to those working with these chemicals and the potential for health effects when a spill occurs. Benzene and toluene are highly volatile so most exposures occur through inhalation causing headache, dizziness, drowsiness, confusion, tremors, and loss of consciousness. They can also cause eye and skin irritation. Chronic exposure to benzene has been linked to a number of leukemias in adults and children (acute myeloid leukemia, acute and chronic lymphocytic leukemia), non-Hodkin’s lymphoma, and multiple myeloma. Chronic exposure can cause aplastic anemia, and it has been linked to immune system effects reducing resistance to infection. Over time, benzene exposure can also cause reproductive problems including abnormal sperm in men, irregular periods, smaller ovaries in women, and low birth weights.
Toxicologists recognize that exposures to a mixture of volatile organic compounds can result in combined toxic effects that lead to worse health effects than the individual chemicals on their own.
Long-term exposure to toluene may harm the nervous system, heart, liver and kidneys. Nervous system effects include reductions in thinking, memory, and muscular abilities. It can also cause hearing loss and color vision loss. At very high levels, toluene can cause permanent toxicity to the brain. It has also been associated with low birth weight. Though there has been some suspicion, currently, there is inadequate data to show that toluene is cancer causing.
refining Facilities
Tar sands refining creates more air pollution, noxious odors, and particular matter pollution than conventional crude oil refinement. Diluted bitumen has 102 time more copper, 11 times more nickel, and 5 times more lead than conventional crude oils, and it is combined with high concentrations of benzene for dilution, all of which are released as air pollutants in the refining process (22). These pollutants have been linked to elevated cancer risks, increased respiratory illness such as asthma, cardiovascular illness, developmental delays, and other detrimental health impacts (23). The process of refining tar sands also requires more heaters, boilers, hydro-treating, and cracking, which are more likely to increase emissions of soot-forming air pollutants (24). Diluted bitumen also has 11 times more sulphur and higher levels of mercaptans, which is tied to central nervous system problems and is an eye, skin, and respiratory irritant. High sulphur levels are also responsible for the noxious odor of tar sands refineries (25).
Refining tar sands also yields a significantly larger amount of petroleum coke than conventional crude (26). Petroleum coke shares many physical and chemical attributes with coal, is full of toxic metals, and is piled outside of refineries in Detroit and Chicago (27,28). Metal-laden dust is blown off these piles and contaminates homes, leading to heart attacks, asthma, decreased lung function, cancers and premature death (29,30). See videos of petroleum coke clouds in Chicago and Detroit here.
The acidic nature of diluted bitumen, which makes it more corrosive in pipeline transport, may also increase the risk of refinery accidents (31).
Extraction
Tar sands are loose sands or sandstone containing sand, clay, water, and bitumen oil. As bitumen is separated from the joining materials, various heavy metals that are toxic to human health, such as mercury, arsenic, and lead become concentrated. Thirteen toxic elements considered priority pollutants under the US EPA Clean Water Act have been found in greater, more hazardous levels near the Athabasca River and its tributaries (3). For example, methylmercury, a potent neurotoxin linked to developmental & behavioral problems, cardiovascular effects, and lower IQ in children has been found to exponentially increase within 30 miles of tar sands processing centers (4,5). Methylmercury bioaccumulates in the food chain, which increases health risks in tribal communities who rely on fishing and hunting in this region (6).
Tar sands are extracted through ‘open pits’ or ‘strip mining’ which requires clear cutting tremendous tracts of boreal forest. Since 85% of the material dug out isn’t bitumen, warm water is utilized to wash it free from sand and clay (7). A massive amount of water is required in this separation process, which later becomes waste water, or tailing ponds. As of 2017, these tailing ponds spanned over 220 square kilometers, or approximately the size of 40,920 American football fields (7). The water in these ponds leak 2.9 gallons each day, releasing benzene, naphthenic acid, ammonia, arsenic, mercury, and lead into the environment (8,9). Additionally, the loss of boreal forest coverage leaves the surface exposed to rain and snow, spurring water erosion. This run-off, which is full of toxic sediments, flows into other water-systems. Sediment tested from lakes and rivers in the Athabasca region surpass Canada’s standards for pollutants, including several that are cancer causing (10,11).

Deforestation for Oil: Photo Courtesy of Greenpeace & John Woods
“...elevated risks of leukemia, childhood lymphohematopoietic cancer, and other cancers of the lymph and blood-forming system.”
Transport
In order to transport and expand tar sand oil production, Enbridge has proposed three pipeline projects in Wisconsin. These proposals are heavily opposed by numerous environmental, tribal, and health groups due to the unique environmental and public health hazards of tar sands pipelines, the disastrous history of Enbridge pipelines in particular, and the added cost of perpetuating the climate crisis.
The Wisconsin Environmental Health Network currently stands along with many of our partners against the following projects proposed in our state:
Line 61: Carrying 400,000 barrels of bitumen a day, from the City of Superior to the Janesville / Beloit area, this line cuts through 240 rivers and steams. Enbridge’s proposal to add new pump stations would force 1.2 million gallons through this line. The added force increases the likelihood for pipeline ruptures and spills. Many Wisconsin residents are also concerned about the construction this project would entail. During the construction of Line 61, Enbridge degraded wetlands, streams, and private properties, resulting in more than 100 environmental violations from the DNR and a 2008 settlement with the state of Wisconsin for $1.1 million in damages (15).
Line 66: This proposed line would follow a similar corridor as four other existing Enbridge pipelines, Line 61, Line 6, Line 14, and Line 13 and would further expand the amount of tar sands oil transported through our state. Wisconsin has already sustained several catastrophic oil spills from the existing pipelines along this route, including a 132,230 gallon spill south of Portage in 1987, a 189,000 gallon spill near Superior in 2003, a 201,000 gallon spill near the Chippewa River in 2007, a 63,000 gallon spill north of Marshfield in 2007, and a 72,618 gallon spill in Adams County in 2012 (16). See Spill Map
Line 5: This line crosses 400 rivers streams and wetlands, and Lake Michigan, threatening one of the largest source of freshwater in the world. This line has released 1.1 million gallons of toxic oil into the environment in its history of 29 spills (17). Enbridge is proposing a reroute for a section of this line, but engineers, health experts, activists, and First Nations groups argue the line should be discontinued. Enbridge’s inspection data from 2013 showed an astonishing 26% loss of the line’s wall thickness, stress cracking, and corrosion, making additional spills more likely (18). If this line were to spill in the Straits of Mackinac, it would contaminate Lake Michigan and Lake Huron which supply drinking water to millions of people.
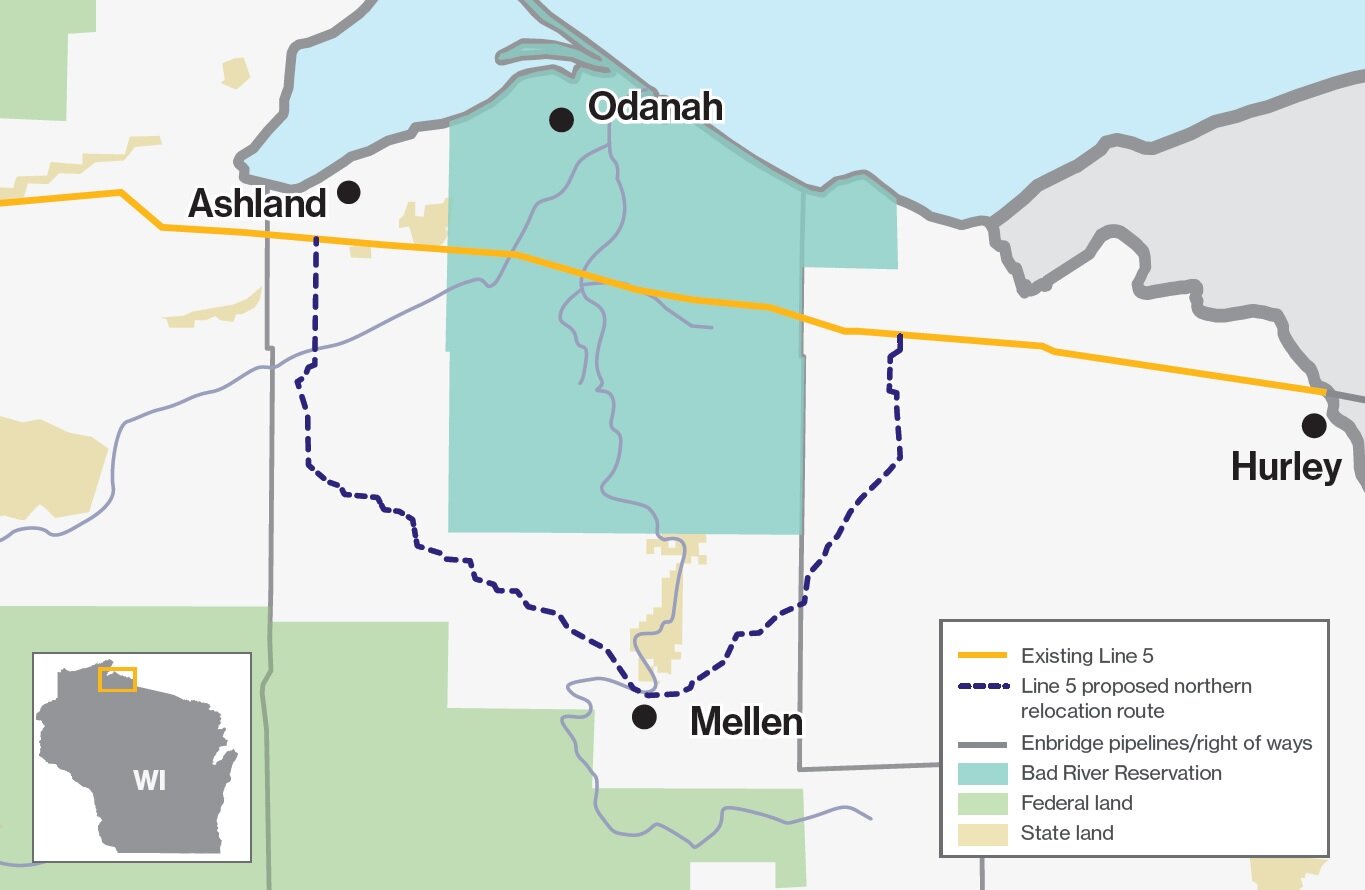
Line 5 Reroute Proposal (Enbridge Inc.)
A Public Health Catastrophe: The Line 5 Kalamazoo Oil SPill
Enbridge has a record of environmental violations. A disastrous rupture of Line 5 in 2010 caused significant contamination of the Kalamazoo River in Michigan. 834,000 barrels of oil (1.15 million gallons) escaped down the river. Many experienced health effects from inhalation of the volatile chemicals including headaches, nausea and vomiting. Initial monitoring of the levels of these chemicals was inadequate since there was no local source for monitoring equipment at the time of the spill, nor was it immediately recognized that this was not ordinary crude oil. According to some reports, it was not until a day later that state and federal agencies were there to monitor benzene levels. After the spill in Michigan, the state Department of Public Health set up a broad surveillance effort that determined 320 people suffered adverse health effects, including cardiovascular, dermal, gastrointestinal, neurological, ocular, renal, and respiratory impacts (19).
“people suffered adverse health effects, including cardiovascular, dermal, gastrointestinal, neurological, ocular, renal, and respiratory impacts”
Tar sands oil spills have proven difficult to clean up (20). The initial clean-up from the Kalamazoo oil spill carried a roughly $1.2 billion price-tag and local residents were displaced from their homes for days to weeks. But clean-up from this spill is still occurring because standard oil spill response measures do not apply to the unique chemical and physical properties of tar sands oil, according to the National Academy of Sciences, Engineering and Medicine. When dilbit spills, the diluents evaporate, leaving behind a sticky tar-like goo that sinks into water. The sinking of pollutants renders most traditional oil clean-up methods which skim the water surface for oil useless (21).
A climate Disaster
The burning of fossil fuels is widely known to be the cause of climate change. Carbon rich tar sands oil has more of an impact than conventional oil and produces 30-70% more greenhouse gas emissions, according to estimates by Alex Farrell and Adam Brandt published in the October 2007 issue of Climatic Change (32). Furthermore, the extraction of tar sands requires clearing immense swatches of boreal forest, which are one of the world’s largest carbon sinks. Boreal forests hold twice as much carbon dioxide as tropical forests and their destruction further accelerates climate change (33). Climate change results in additional health impacts, for more visit our climate and health page.
“The extraction and refining of tar sands produces 30-70% more greenhouse gas emissions than conventional oil production...”
_____________________________________
Pipelines in The News
_____________________________________
Canada’s Tar Sands Landscape from the Air in Pictures
The Guardian (August 3, 2015)
This series of riveting images provides a visual for the widespread environmental degradation.
This is the World’s Most Destructive Oil Operation- and it’s growing
National Geographic (April 11, 2019)
The human-made structures oil extraction structures are big enough to see from space, here is what that means for health.
Higher cancer rates confirmed near Canada’s Oil Sands
Reuters (February 5, 2009)
Aboriginal villages downstream of Canada’s Oil Sands Plants experience high rates of rare disease.
Alberta Officials are signalling they have no idea how to clean up toxic oilsands tailing ponds
Canada’s National Observer (November 23, 2018)
After billions of dollars and decades of research, scientists are still unsure how to safely clean the miles of toxic tailings that threaten wildlife, groundwater, and human health.
Enbridge Pipeline Expansion, larger than keystone, drawing some Dane county skeptics
Wisconsin State Journal (January, 2015)
Concerns about pollution of rivers, lakes and groundwater combines with alarm surrounding the toxic fumes that sicken those exposed, has residents fearful about another pipeline through Wisconsin.
Tailing Ponds a critical part of Alberta’s Tar Sands Legacy
Calgary Herald (September 28, 2017)
A recent analysis estimates that tailings will reach 1.5 trillion liters in size and they won’t begin to disappear until roughly 2110. Due to the long timeline, taxpayers may be stuck paying the clean up bill.
New Research Gives a Clearer picture of where oil might go if line 5 breaks open in the Great Lakes
Michigan NPR (Mach 31, 2016)
The result of 840 computer simulated spills reveals that 720 miles of shoreline in the U.S and Canada are at risk. Even a small spill in this area would have a massive impact.
Alberta Tar Sands
A Story Map (November 21, 2019)
Using images, video, and maps to illustrate massive levels of pollution and destruction, this story illustrates how extraction negatively impacts health, especially for first nations.
Wisconsin Oil Spill is Canadian firm’s worse since 2010 disaster
Los Angeles Times (July 29, 2012)
Enbridge is responsible for spilling 50,000 gallons of oil in Wisconsin, only two years after they promised increased safety measures following the spill of 800,000 gallons of oil in Michigan in 2010.
Please see the NRDC’s Issue Brief that details the health effects of tar sands oil for more information.
Sources:
Millington, Dinara; Murillo, Carlos A. 2015. Canadian Oil Sands Supply Costs and Development Projects (2015–2046) Canadian Energy Research Institute.
“Stopping Tar Sands Oil through Wisconsin.” Sierra Club, 8 Apr. 2020, www.sierraclub.org/wisconsin/stopping-tar-sands-oil-through-wisconsin.
Kelly, E.N.; Schindler, D.W.; Hodson, P.V.; Short, J.W.; Radmanovich, R.; Nielsen, C.C. 2010. Oil sands development contributes elements toxic at low concentrations to the Athabasca River and its tributaries. PNAS. 107 (37): 16178–83.
Jane L. Kirk, et al., “Trends in Atmospheric Deposition of Inorganic Contaminants to the Alberta Oil Sands Region Obtained from Snowpack and Lake Sediment Core Measurements” (forthcoming, Spring 2014), abstract at longbeach.setac.org/sites/ default/files/SETAC-abstract-book-2012.pdf
USEPA, Integrated Risk Information System: Methylmercury (MeHg), (Aug. 2012), www.epa.gov/iris/subst/0073.htm.
California Office of Environmental Health Hazard Assessment, Methylmercury in Sport Fish: Information for Fish Consumers (Aug. 1, 2013), oehha.ca.gov/fish/hg/
Kent, Gordon. “Tailings Ponds a Critical Part of Alberta's Oilsands Legacy.” Calgary Herald, Calgary Herald, 28 Sept. 2017, calgaryherald.com/business/energy/tailings-ponds-a-critical-part-of-albertas-oilsands-legacy.
Pembina Institute, Oil Sands: Tailings (accessed Jul 10, 2020), www.pembina.org/oil-sands/os101/tailings.
Environmental Defence Canada, 11 Million Litres a Day: The Tar Sands’ Legacy 2 (Dec. 2008), environmentaldefence.ca/ reports/11-million-litres-day-tar-sands-leaking-legacy
Joshua Kurek et al., “Legacy of a Half Century of Athabasca Oil Sands Development Recorded by Lake Ecosystems” 1, Proc. Natl. Acad. Sci. U.S. (Nov. 19, 2012), intl.pnas.org/content/ early/2013/01/02/1217675110.full.pdf+html.
Kelly, E.N.; Short, J.; Schindler, D.W.; Hodson, P.V.; Mingsheng, M.A.; Kwan, A.K.; Fortin, B.L. 2009. Oil Sands Development Contributes Polycyclic Aromatic Compounds to the Athabasca River and Its Tributaries. Proc Natl Acad Sci USA. 106(52):22346-51.
“UCI-Led Study Documents Heavy Air Pollution in Canadian Area with Cancer Spikes.” UCI News, 5 Feb. 2015, news.uci.edu/2013/10/22/uci-led-study-documents-heavy-air-pollution-in-canadian-area-with-cancer-spikes/.
Yiqun Chen, “Cancer Incidence in Fort Chipewyan, Alberta, 1995-2006” 25 (Feb. 2009), Alberta Cancer Board Division of Population Health and Information Surveillance, www.ualberta. ca/~avnish/rls-2009-02-06-fort-chipewyan-study.pdf.
Gina Solomon, “The Other Disaster: Cancer and Canada’s Tar Sands,” Switchboard, Natural Resources Defense Council blog (May 3, 2010), switchboard.nrdc.org/blogs/gsolomon/the_other_ oil_disaster_cancer.html.
Verburg, Steven. “Enbridge Pipeline Expansion, Larger than Keystone, Drawing Some Dane County Skeptics.” Madison.com, Wisconsin State Journal, 11 Jan. 2015, madison.com/wsj/news/local/environment/enbridge-pipeline-expansion-larger-than-keystone-drawing-some-dane-county/article_6e0902a9-cf15-5fcc-8bf6-81ce96f370ba.html.
“The Oil Pipelines of Wisconsin.” Jsonline.com, Journal Sentinel, projects.jsonline.com/news/2017/11/9/oil-pipelines-of-wisconsin.html.
Ellison, Garret. “Enbridge Line 5 Has Spilled at Least 1.1M Gallons in Past 50 Years.” Mlive, 26 Apr. 2017, www.mlive.com/news/2017/04/enbridge_line_5_spill_history.html.
“Line 5 Inspection Results: Metal Loss/Corrosion.” Enbridge Inc., Enbridge Inc., 2013, www.enbridge.com/Projects-and-Infrastructure/Public-Awareness/Line-5-Michigan/Safeguarding-the-Great-Lakes/Inspections/Inline-inspection-results/Results-metal-loss-corrosion.aspx.
Michigan Department of Community Health, Acute HealthImpacts of the Enbridge Oil Spill (Nov. 2010), www.michigan. gov/documents/mdch/enbridge_oil_spill_epi_report_with_cover_11_22_10_339101_7.pdf.
EPA, Dredging Continues on Kalamazoo River (Nov. 21, 2013), www.epa.gov/region05/enbridgespill/.
Hirji, Zahra. “Unique Hazards of Tar Sands Oil Spills Confirmed by National Academies of Sciences.” InsideClimate News, 9 Dec. 2015, insideclimatenews.org/news/09122015/unique-hazards-tar-sands-oil-spills-dilbit-diluted-bitumen-confirmed-national-academies-of-science-kalamazoo-river-enbridge.
Richard E. Meyer et al., “Heavy Oil and Natural Bitumen Resources in Geological Basins of the World” 14, Table 1 (2007), U.S. Geological Survey, pubs.usgs.gov/of/2007/1084/OF2007- 1084v1.pdf.
Diane Bailey, “Gasping for Air: Toxic Pollutants Continue to Make Millions Sick and Shorten Lives” 1, 3 NRDC Health Facts (July 2011), www.nrdc.org/health/files/airpollutionhealthimpacts. pdf.
Keven Turini, et al., “Processing Heavy Crudes in Existing Refineries” 9 (2011), prepared for spring 2011 meeting of AIChE, Chicago, www.aiche-fpd.org/listing/112.pdf.
NRDC. (Feb. 2014) Tar Sands Crude Oil: Health Effects of Dirty and Destructive Fuel. https://www.nrdc.org/sites/default/files/tar-sands-health-effects-IB.pdf
Compare British Petroleum, How Calcined Petroleum Coke
Is Produced (2014), www.bp.com/extendedsectiongenericarticle. do?categoryId=9037970&contentId=7069740 (explaining that most crude oils contain only 5-7% unrefinable by-product by weight), with Oilchange International, “Petroleum Coke: The Coal Hiding in the Tar Sands” 6 (Jan. 2013), priceofoil.org/content/uploads/2013/01/OCI.Petcoke.FINALSCREEN.pdf (suggesting that tar sands—derived crudes contain 15-30% unrefinable by-product by weight)
Michael Hawthorne, “Chicago Moves to Enclose Piles of Petroleum Coke,” Chicago Tribune (Dec. 19, 2013), articles. chicagotribune.com/2013-12-19/news/ct-petcoke-regulationsmet-20131219_1_kcbx-uncovered-piles-petroleum-coke.
Ian Austen, “A Black Mound of Canadian Oil Waste Is Rising Over Detroit,” New York Times (May 17, 2013), www.nytimes. com/2013/05/18/business/energy-environment/mountain-of-petroleum-coke-from-oil-sands-rises-in-detroit.html.
Jeff Gearhart, Ecology Center (April 2, 2013), docs.housedems.com/district/006/CokeAggregrateCombined.pdf.
USEPA, Particulate Matter: Health (Mar. 18, 2013), www.epa.
gov/pm/health.html.
“Long Lake Heavy (PSH),” Crudemonitor.ca (2014), www.crudemonitor.ca/crude.php?acr=PSH.
Tenenbaum, David J. “Oil Sands Development: A Health Risk Worth Taking?” Environmental Health Perspectives, vol. 117, no. 4, Apr. 2009, doi:10.1289/ehp.117-a150.
The Narwhal. “New Map Shows Dramatic Time Lapse of Tar Sands Deforestation.” The Narwhal, 15 July 2014, thenarwhal.ca/new-map-shows-dramatic-time-lapse-tar-sands-deforestation/.